
Recently I have been working intensively to finish a new project called ‘Ursae Minoris’, in collaboration with composer Claudio F. Baroni and double bass player Dario Calderone. It is based on a musical score in three parts for double bass and electronics that Claudio Baroni composed over the last two years, and about six months ago I was commissioned by the Solaris Foundation to develop a visual dimension to his work.
After a tryout at the Volkssterrenwacht Copernicus (an astronomical observatory run by enthousiasts), the premiere of this complete version took place on the 15th of October 2016 in The Hague during the ‘Dag in de Branding’ festival. Since then we have had performances at music festivals in Groningen and Den Bosch, and more dates are planned for 2017, for now comprising performances at music festivals, the International Film Festival Rotterdam, media art festivals and smaller performances at various observatories around The Netherlands.

Claudio’s musical score of ‘Ursae Minoris’ was inspired by an account of the travels of Ciriaco d’Ancona (1391-1455), an itinerant Italian humanist, textile merchant and antiquarian. Driven by his curiosity, he navigated around the Mediterranean from the south of Italy to Egypt and Greece, repeatedly mentioning the constellation Ursa Minoris (the “Little Dipper”) as his constant reference point. The total score is a map of crossing paths in which the double bass player can determine his own trajectory, accompanied by live electronics and live visuals.
The musical material was determined by transcribing star maps of the constellation Ursa Minor and the area surrounding it, translating star positions and brightnesses into pitches and note lengths. With these pitches as a starting point, Claudio and Dario investigated formal aspects and musical techniques. Each of the three parts is based on the range of sonic possibillities offered by a specific playing technique for the double bass. The first part has a baffling range of ‘extended techniques’ of a percussive nature. Part two is built up out of constant and very slow glissandi. Part three is one extremely long tremolo that ranges from almost inaudible to extremely loud.
Each of the three parts of the written music is performed in a different type of dialogue with live analog electronics performed by Claudio Baroni, based on earlier recordings of the musical material.

When thinking about an approach to the visuals, I started from the idea of navigation, and more specifically the act of observation of the stars considered as a kind of analogy for the idiosyncratic translation of star maps into music in the combined efforts of Claudio and Dario. Thinking about the contrast between the unvarying realm of the stars and the very much varying realms of itinerant merchants, navigators, composers and double-bass players, I came to focus on what happens to the light from the stars as it traverses the atmosphere, as one of the sources of variation in star observations and as a source of a whole range of ephemeral visual phenomena. Atmospheric optics has been an interest of mine for a long time, and the first idea for this project was to start from simulations of the various kinds of scattering of light by air molecules, water drops and small ice crystals. Phenomena like rainbows, fog bows, glories, light pillars and the twinkling of stars are all a result of such interactions between light and our atmosphere.
As part of my preliminary research, I finally read (most of) Carl Boyer‘s classic book on the rainbow; “The Rainbow, from Myth to Mathematics” (Thomas Yoseloff / Sagamore Press, New York, 1959). It is a great book in that it contains a wealth of material from the (Western) history of ideas about the rainbow; through the subject of the rainbow it reflects all of the large shifts in the (Western) history of science. It is amazing how many important scientists and thinkers were especially interested in the rainbow, and also it is amazing how many poetic ideas were manifested in the various kinds of explanations through the ages. One can also not help wondering how it is possible to turn all this fantastic material into what for some reason remains a rather dull book to read.
One example of the beautiful and poetic ideas that are found throughout the book is the theory of the rainbow as explained by Francesco Maurolico in his “Photismi de lumine etc. etc.” (written around 1523 but integrally published only in 1611). It is the first explanation of the rainbow that considers the internal reflections of light in the raindrop, and through the thorougly Pythagorean mindset of its author this resulted in this beautiful image of perfect octaves in every drop, explaining the angle of approximately 45 degrees (in fact closer to 42 degrees) at which the rainbow is visible.


The last theories of the rainbow that are discussed in Boyer’s book build on the mathematical formulation in 1838 by George Airy of the insight of Thomas Young, according to which the colours of the rainbow are produced by the interference of light waves as they are diffracted by spherical raindrops. Unfortunately the book stops before discussing the work of Gustav Mie, which is where things become even more interesting when thinking of some kind of application in simulation. Mie made the formulation of Airy much more precise, and the scattering of electromagnetic waves by small spheres is still referred to as Mie-scattering because of his work. The practical problem with these calculations is that they are timeconsuming: still possible for very small particles, but totally impossible to do by hand for spheres that are as big as raindrops and for light that constists of many wavelengths. Such calculations only became feasible with the use of computers.
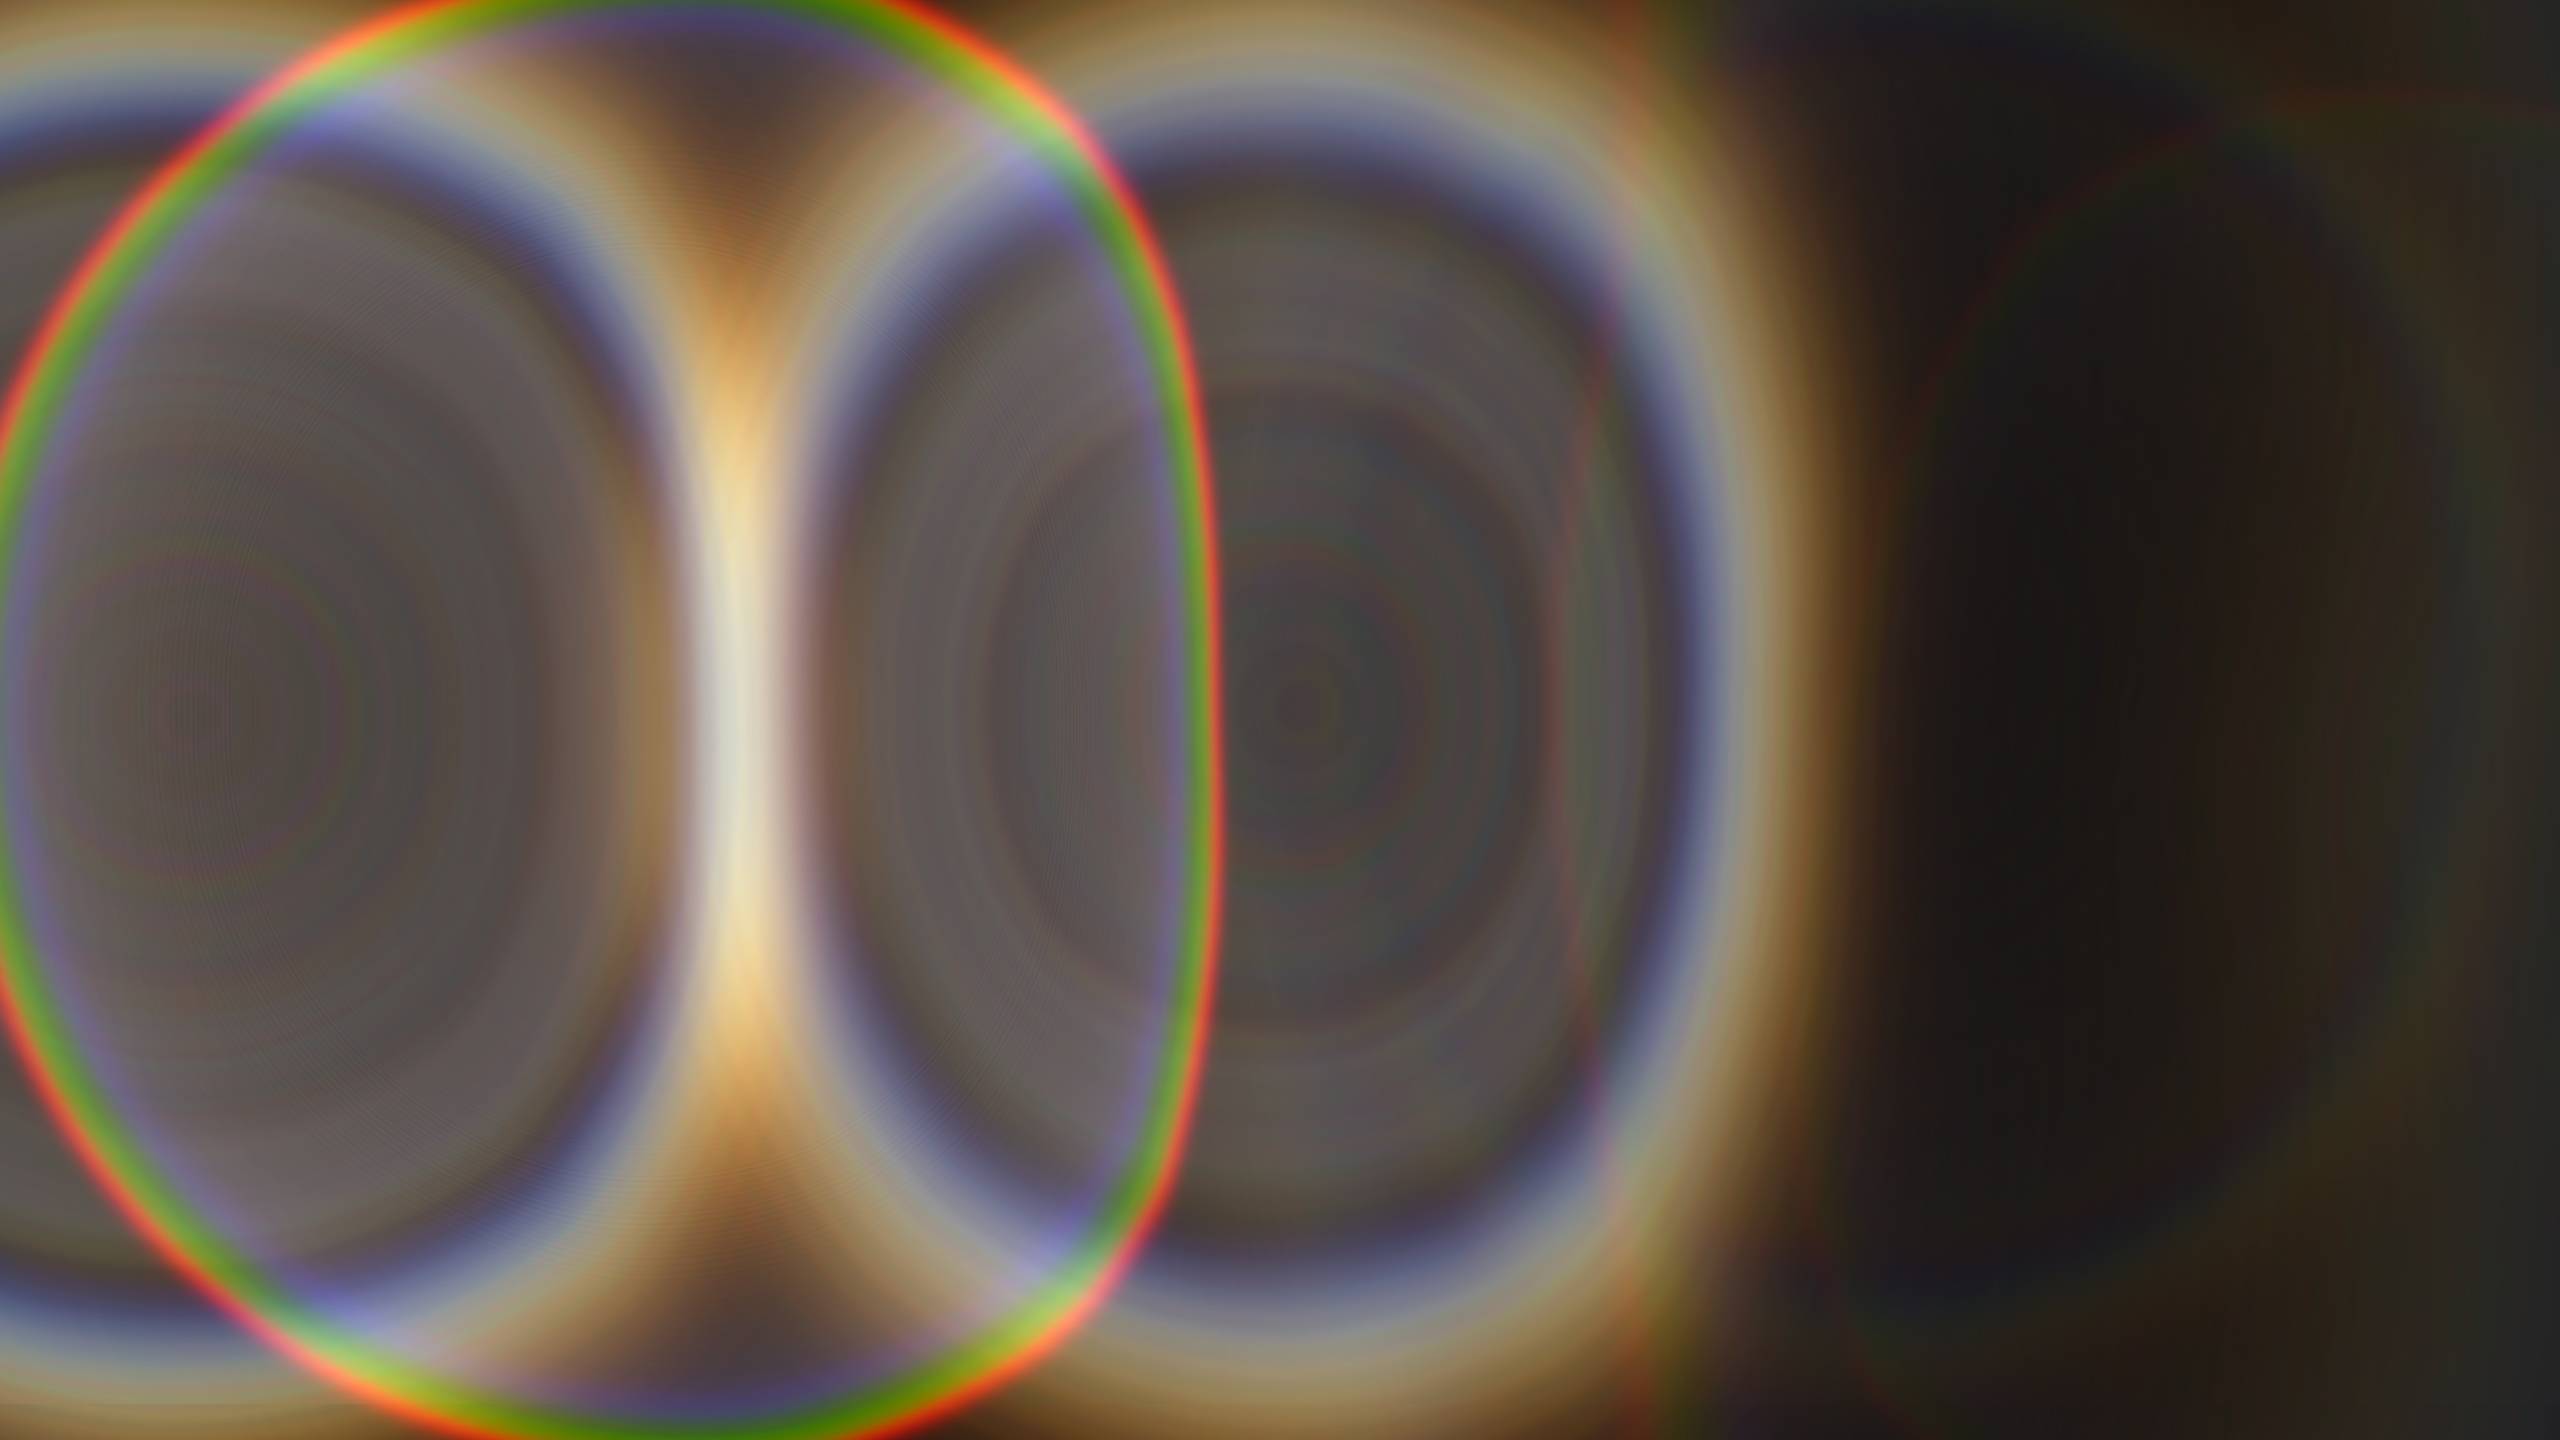
Already quite some time ago I learned about these things through papers such as this one by Raymond Lee, but at the time I was rather quicky discouraged to attempt to do such simulations myself. When looking for software, most of it turned out to be closed source (perhaps the most well-known example is the MiePlot software by Philip Laven, but I found about ten more researchers working on physical models of rainbows; most of them do not share code because they seem to expect to earn money from use in computer games and flight simulators). Pretty much all the references that I found went back to a FORTRAN routine published in 1983 in Bohren and Huffman’s book “Absorption and Scattering of Light by Small Particles” (Wiley, New York, 1983), a routine which itself goes back to FORTRAN code developed in 1968. With some help of repositories like this one, I was able to use this routine and some of its close relatives as a starting point for a software instrument for generating live visuals, made with FORTRAN, Python and GLSL shader code.

The visual material that I use in ‘Ursae Minoris’ is to some extent summed up in the ‘Lee Plot’ above; a diagram of colours and light intensities that has visual angle relative to the sun on the x-axis, and the (log) drop size on the y-axis. In my Lee plot above the angles run from 90 (left) degrees to 180 (right), and the drop sizes run from the finest drops that can be found in fog (top) until drops that are about 1 cm in size (bottom). The vertical line a bit to the right in the lower half of the plot corresponds to the primary rainbow we most often see in the sky, the other vertical line corresponds to the secondary rainbow, and the dark band between them is Alexander’s band. If we would zoom in, we would see that these two ‘rainbows’ are accompanied by many small echo’s that become larger and fuzzier as the drops get smaller; the supernumary arcs.
What I like in these plots are the non-linear and rather unpredictable interference patterns that arise for instance with very small drops (as in fog, even though the variations in dropsize in real fog are normally much too big to really see these phenomena), or close to the 180 degree angle (these correspond to ‘glories‘).
Rainbows would be so cool if raindrops were 1000x smaller !

My software instrument uses this basic material in geometries that are derived from the interactions between spheres. With this, I developed a visual composition that has the same kind of open structure as the musical score, and which has continued to develop during the performances in the last month. For now, there is a version for a single screen, but I am still thinking about perhaps developing a more spatial setup with two or three screens, and in the beginning of next year I will certainly make a version for dome shaped theatres and planetaria.

My work on ‘Ursae Minoris’ was financially supported by the Creative Industries Fund nl.